
Stock Rover
Deep fundamental analysis and stock screening for value investors
Our Verdict
Stock Rover is the most comprehensive fundamental screening and portfolio analysis platform available to retail investors at its price point. If you are a buy-and-hold investor who wants institutional-grade research at a fraction of the cost, this is your best option.
Best for: Value investors, dividend-focused portfolios, and growth investors who want deep fundamental screening
Our Experience
Stock Rover in Action
Who Should Use Stock Rover
Stock Rover is best suited for self-directed investors who conduct their own fundamental research and take a medium-to-long-term view. If you are a value investor screening for undervalued stocks using metrics like price-to-Graham-number, margin of safety, or Piotroski F-Score, this platform was essentially built for your workflow. Dividend investors benefit from the 22 unique dividend metrics, income projections, and dividend safety indicators. Growth investors can leverage the ranked screening and equation tools to build customized filters that surface stocks matching precise criteria. Portfolio managers — whether professional or individual — who want to track performance across multiple brokerage accounts, run Monte Carlo simulations, and monitor rebalancing needs will find the analytics suite comprehensive and well-integrated. Users comfortable with data-dense interfaces and willing to invest time in learning the platform will extract outsized value relative to the subscription cost.
Who Should Avoid Stock Rover
Day traders, swing traders, and anyone relying on real-time data for intraday decisions should look elsewhere — Stock Rover does not provide real-time quotes, and its charting tools are designed for fundamental overlays rather than technical trading signals. Investors focused on international markets, cryptocurrency, or forex will find no coverage here; the platform is limited to US and Canadian equities, ETFs, and mutual funds. Complete beginners may find the 650+ metrics and dense table-based interface intimidating without prior familiarity with financial ratios and screening concepts. Users who want an integrated trading capability — the ability to execute trades directly from the research platform — will be disappointed, as Stock Rover is purely an analysis tool with read-only brokerage connections. Finally, those who need robust mobile access should note the absence of a native app; the HTML5 responsive interface on Premium tiers is functional but not a substitute for a dedicated mobile experience.
What is Stock Rover?
Stock Rover specializes in fundamental analysis with over 650 financial metrics, powerful screening, and detailed research reports. Its portfolio analytics track performance against benchmarks with Morningstar-level depth. Built for buy-and-hold investors and value investing strategies rather than active day trading.
Key Strengths
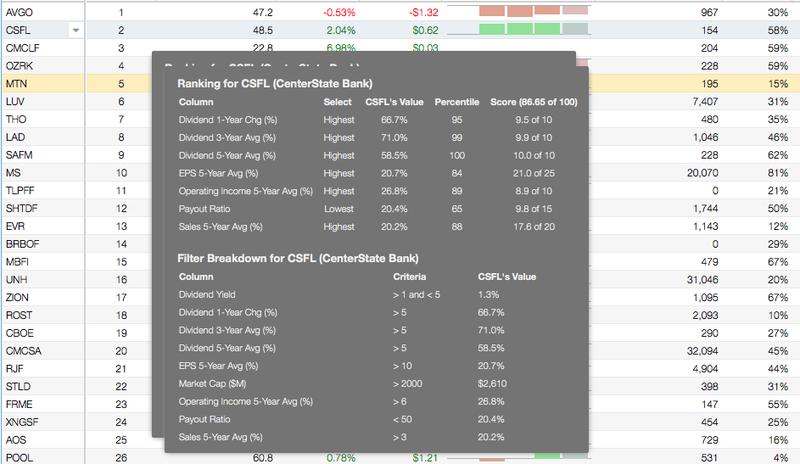
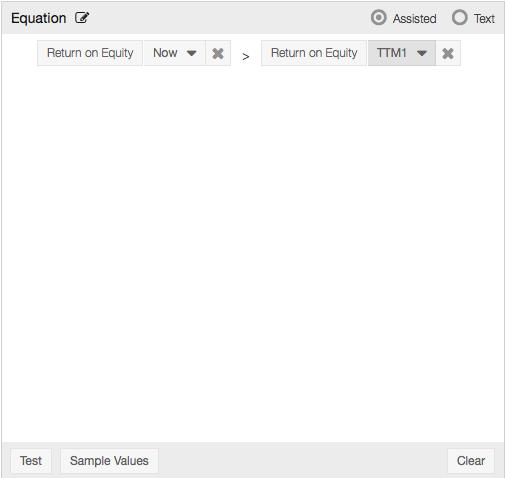
Stock Rover offers over 650 financial screening metrics — more than any competing retail screener we have tested. The breadth spans standard valuation ratios and profitability measures to specialized metrics including Piotroski F-Score, Altman-Z Score, Shiller PE, Greenblatt Return on Capital, Sloan Ratio, and proprietary fair value calculations with multiple margin-of-safety methods. The equation screening feature on Premium Plus allows users to combine these metrics into custom formulas, enabling strategies that standard filter-based tools simply cannot express. With 10 years of historical data available, investors can backtest criteria against a full market cycle — a capability rare at this price point.
The portfolio management suite rivals tools that cost thousands per year. Monte Carlo simulations project long-term growth under varied scenarios, including planned withdrawal testing for retirees. Dividend income forecasting projects future income at the summary, portfolio, and individual holding level. The rebalancing facility monitors sector and position drift against user-defined targets and generates specific trade lists when thresholds are breached. Correlation analysis helps identify diversification gaps. All of this runs on top of automatic brokerage sync through Yodlee, supporting over 1,000 brokerages — from major firms to smaller regional institutions — so there is no manual data entry required.
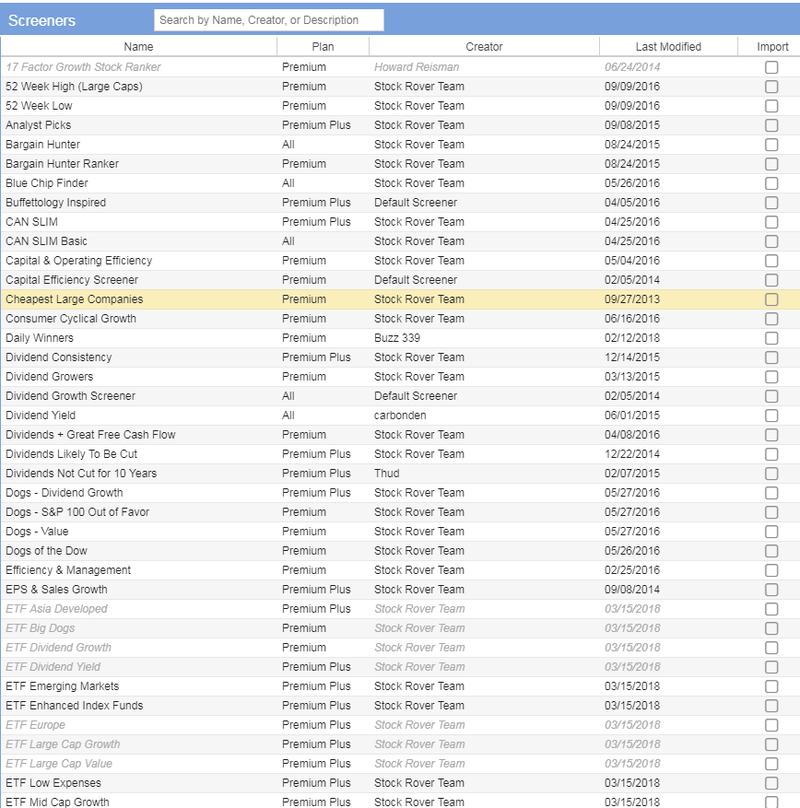
The Investors Library contains over 150 pre-built screeners covering virtually every established investment strategy — from deep value and dividend growth to momentum and quality factor screens. Many are modeled on the documented approaches of renowned investors and academic research. This means investors can begin productive screening immediately without building custom filters from scratch. Each screen can be modified and saved as a custom variation, creating a practical on-ramp that reduces the learning curve significantly.
At $7.99 to $27.99 per month, Stock Rover undercuts nearly every comparable platform. Finviz Elite costs $39.50 per month with fewer fundamental metrics. Seeking Alpha Premium runs $299 per year with a different focus. Morningstar Investor starts at $199 per year but offers fewer screening dimensions. Portfolio analytics tools of comparable depth operate at entirely different price tiers. The free tier alone provides basic screening that several users have described as more useful than some competitors' paid offerings.
Key Weaknesses
Stock Rover is limited to US and Canadian equities, ETFs, and mutual funds. Investors with globally diversified portfolios will find no data on European, Asian, or emerging market securities. A user noted that even attempting to use the platform from outside North America results in noticeably slow load times. This geographic limitation narrows the platform's utility for anyone whose investment universe extends beyond North American markets — a significant constraint as global diversification becomes an increasingly standard portfolio construction approach.
Stock Rover offers no native mobile application. Premium and Premium Plus subscribers can access an HTML5 responsive interface on mobile devices, but free and Essentials users are limited to desktop browsers. The absence of real-time quotes means the platform is unsuitable for any time-sensitive investment decisions. Charts are designed for fundamental analysis overlays rather than technical trading, and the data refresh cadence is built for investors who check positions daily or weekly, not hourly.
The platform's greatest strength — its depth — is also its most common source of friction. With 650+ metrics, 150+ screeners, and a dense table-based interface, new users routinely report feeling overwhelmed. Multiple expert reviewers noted the learning curve as the platform's primary drawback. While the V11 update improved navigation and the Investors Library provides ready-made starting points, mastering the full toolkit requires a genuine time investment.
What Users Say
Key Features
Stock Rover Pricing
Free
- ✓ Basic screening
- ✓ Limited metrics
- ✓ 5 years history
Essentials
- ✓ 150+ metrics
- ✓ 10 years history
- ✓ Portfolio analysis
- ✓ Charting
Premium
- ✓ 650+ metrics
- ✓ Brokerage integration
- ✓ Research reports
- ✓ Correlation analysis
Premium Plus
- ✓ All Premium features
- ✓ Analyst ratings
- ✓ Guru strategies
- ✓ Priority support
Integrations
Getting Started
Getting started with Stock Rover takes under ten minutes. Sign up for a free account on stockrover.com — no credit card required. Once registered, the platform opens to a default workspace with the table view, chart, and insight panel visible. Begin by exploring the Investors Library, which contains over 150 pre-built screeners organized by strategy type — value, growth, dividend, momentum, and more. Click any screener to run it instantly and see qualifying stocks populate the table. To customize, modify filter criteria and save as a personal screener. For portfolio tracking, navigate to the Portfolios section and either create a manual portfolio or connect a brokerage account through the Yodlee integration — Stock Rover supports over 1,000 brokerages including Fidelity, Schwab, Interactive Brokers, Robinhood, E*TRADE, and Vanguard. The connection is read-only and positions sync automatically. Set up alerts for price levels, volume changes, or earnings events through the Alerts menu — notifications arrive via email or text. To evaluate paid features, start the 14-day free trial from the account settings. The platform includes tutorial videos and a detailed help center, and customer support responds to email inquiries — with users noting that responses often come directly from the engineering team.
Pricing Analysis
Stock Rover's pricing is among the most competitive in the fundamental analysis space. The free tier provides basic screening with five years of historical data — genuinely usable for casual research. Essentials at $7.99 per month (or $79.99 annually) adds 150+ metrics, 10 years of history, portfolio analysis, and charting. Premium at $17.99 per month ($179.99 annually) unlocks the full 650+ metrics, brokerage integration, research reports, and correlation analysis — this is the tier where the platform's core value becomes fully accessible. Premium Plus at $27.99 per month ($279.99 annually) adds equation screening, analyst ratings, guru strategies, and priority support — the best choice for power users building custom quantitative screens. A 14-day free trial requires no credit card, lowering the barrier to evaluation. Research reports are available as a separate add-on at $49.99 to $99.99 per year for annual subscribers. The main pricing caution is customer support: email-only support is standard, and phone support requires a Premium or Premium Plus annual subscription plus a $50 per year add-on — an unusual structure that may frustrate users who expect phone access at these price points. Relative to the market, Stock Rover's Premium Plus at $27.99 per month delivers more screening depth than Finviz Elite at $39.50 per month and more portfolio analytics than Morningstar Investor at $199 to $249 per year.
How Stock Rover Compares
Stock Rover competes primarily with Finviz, Seeking Alpha, Morningstar, and Portfolio123 — though each targets a somewhat different investor profile. Finviz Elite ($39.50/month) offers real-time data and broader international coverage but only 67 fundamental screening criteria versus Stock Rover's 650+; it is the better choice for traders who blend technical and fundamental analysis. Seeking Alpha Premium ($299/year) excels in crowd-sourced research articles and proprietary Quant Ratings but offers no portfolio analytics or custom screening depth — it complements rather than replaces Stock Rover. Morningstar Investor ($199–249/year) provides professional analyst coverage, fair value estimates, and stronger mutual fund data, but its screener is less customizable and its portfolio tools are shallower. Portfolio123 ($250–500/year) is the closest functional competitor, offering backtesting and portfolio simulation, but at a higher price with a steeper learning curve. Among free options, TradingView leads for charting and community, while Finviz free covers basic screening with international reach. Stock Rover's competitive position is strongest for US-focused value, dividend, and growth investors who want deep screening combined with portfolio analytics — a combination no single competitor matches at this price.
The Bottom Line
Stock Rover is the most comprehensive fundamental screening and portfolio analysis platform available to retail investors at its price point. With 650+ metrics, 150+ pre-built screeners, institutional-grade portfolio analytics, and pricing starting at $7.99 per month, it delivers genuine value for US-focused value investors, dividend portfolios, and growth strategies. The learning curve is real and the US-only coverage is a hard constraint, but for investors who fit its target profile, no single competitor matches this combination of depth and affordability.
Sources
Explore More
Compare with similar tools →
Full pricing plan breakdown →
Side-by-side comparison →
Side-by-side comparison →
Side-by-side comparison →
Side-by-side comparison →
Ready to try Stock Rover?
Try Stock Rover